Showing posts with label distilled water. Show all posts

Tuesday, May 3, 2016

MITOSIS IN AN ONION ROOT

Introduction: 
In this experiment we will see the parts of the mitosi (interfase, profase, metafase, anafase and teloface) in a onion root.


Material:
- Microscope
- Slide
- Coverslip
-Dropper
-Needles emmanegades
- Watch glass
- Beaker
- Thin tongs
- lighter
- Cellulose paper

Quemical products: distilled water, Orceine A and B and normal water.
Natural products: Onion

Procedure: 

1). Put the onion in a beaker with water one week (the roots need to touch the water). 
2). When the roots grow up 3cm, cut the final 4 mm and put in the watch glass with orceine A. 
Then, you need to put in  the heater with the flame of the lighter until you see vapor (In this process the temperature can't pass the 60 C). 
3). With the tongs take the piece of the root and put in a slide and put the orceine B with the dropper. 
4). Put the coverslip and with a piece of cellulose paper you need to push and turn in the coverslide to extend de cells. 
5). Observe with the microscope with 600 increases and you will see the parts of the mitosi. 


Observations: 


In this experiment we can't see very well the different parts of the mitosis. 


Tuesday, February 23, 2016

RED ONION OSMOSIS

Introduction: 
In this experiment we will see the process called osmosis of a red onion, with different material (distilled water, salt water and a microscope).

Objectives:
- To see what happens to the piece of onion when we put distilled water and salt water.

Process:
PHASE 1: NORMAL CELLS/DRY MOUNT 
1. Carefully slice away the colored layer of cells from the red onion. This should only be the thin purple layer. Trim to get a piece about this actual size.
2. Place the thin, purple onion layer on a dry microscope slide shinny side up-do not put on water or cover slip yet.
3. Scan the entire onion tissue on low power to find and center the most purple area and focus. Set the microscope to medium power and focus the view.
4. Take a picture


PHASE 2: SALT WATER ENVIRONMENT/WET MOUNT 
Now that you have observed the layer of normal cells which are the subject of this lab, make a wet mount using 2 or 3 drops of salt water solution on the onion tissue then install cover slip.

5. Watch the cells for approximately 2-3 minutes or longer as you again survey the entire onion tissue on low power. You should see changes within many of the cells intially near the perimeter of the onion tissue. As time passes all or most of the cells shoulb become affected by the salt water. Find some cells that have noticeably been affected and observe them under medium power.


Obervations: We can see the process of plasmolosis 


PHASE 3: DISTILLED WATER ENVIRONMENT/WET MOUNT 

6. After you have colored the diagram correctly above, you need to prepare for phase 3 of this lab by putting the entire salt water wet mount in the dish of tap water to rinse off the salt water from the slide, cover slip and onion tissue layer. Dry the slide and cover-slip then gently dab the onion tissue dry.

7. Make a wet mount of the onion tissue you just rinsed using 2 or 3 drops of distilled water on the onion tissue then install cover slip. Watch the cells for approximately 2-3 minutes or longer as you again survey the entire onion tissue on low power. You should see changes within many of the cells intially near the oerimeter of the onion tissue. As tine passes all or most of the cells should become affected by the distilled water. Find some cells that have noticeably been affected by the distilled water and observe them under medium power.


Observations: The cells become more bigger because they took the water

Questions: 
1. When the salt solution was added to the onion cells, where was the greater concentration (most pure) of water? (inside or outside the cell membrane). How do know this? Explain:
Answer: Inside, because outside is the salt solution.

2. In the winter, grass often dies near the roads that have been covered in salt to remove the ice. Using what you have learned in this experiment, what do you think is the reason the grass dies?
Answer: The cells leaved water.

3. Which kinf of transport does water follow across the membrane?
Answer: Passive (membrane difussion)

Tuesday, February 2, 2016

DNA EXTRACTION

INTRODUCTION: 
Deoxyribonucleic acid (DNA) is a nucleic acid that encodes the genetic instructions used in the development and functioning of all known living organisms and many viruses.
Nucleic acids are biopolymers formed by simple units called nucleotides. Each nucleotide is composed of a nitrogen-containing nucleobase (G, T, C, A) as well as a monosaccharide and a phospate group.

OBJECTIVES: 
1. Study DNA structure.
2. Understand the process of extracting DNA from a tissue.

PROCEDURE:
(Put the ethanol in the freezer) 

- Prepare the buffer in a 0'5L beaker: Add 450mL of tap water, 25mL of a dish soap and 7g NaCl. Stir the mixture.

1. Peel the kiwi/banana and chop it to small pieces. Place the pieces of the kiwi in one 600mL beaker and smash with a fork until it becomes a juice puree. 
2- Add 8mL of buffer to the beaker. 
3. Mash the kiwi/banana puree carefully for 1 minute without creating many bubbles. 
4. Filter the mixture: put the funnel on top of the graduated cylinder. Place the cheesecloth on top of the funnel. 
5. Add beaker contain carefully on top of the cheesecloth to fill the graduated cylinder. The juice will drain through the chessecloth but the chucks of kiwi/banana will not pass through into the graduated cylinder. 
6. Add the pineapple juice to the green juice (you will need about 1mL of pineaplle juice to 5mL of the green mixture DNA solution). This step will help us to obtain a purer solution of DNA. Pineapple juice contains an enzyme that breaks down proteins. 
7. Tilt the graduated cylinder and pour in a equal amount of ethanol witg an automatic pipet. Put the ethanol through the sides of the graduated cylinder very carefully. You will need about equal volumes of DNA solution to ethanol. 


8. Place the graduated cylinder so that it is eye level. Using the stirring rod, collect DNA at the boundary of ethanol and kiwi/banana juice. Do not stir the kiwi juice; only stir in the above ethanol layer. 
9. The DNA precipitate looks like long, white and thin fibers. 
10. Gently remove the stirring rod and examine what DNA looks like. 


FINAL RESULT:
This is the final result when que took the DNA and we saw it with the microscope. 


Tuesday, January 5, 2016

PROTEIN DENATURATION

INTRODUCTION: 
Denaturation is a process in wich proteins or nucleic acids lose the quaternary, tertiary and secondary structure that is present in their native state. Denaturation is the result of the application of some external stress (heat and pH change) or compounds such as a strong acid or base, a concentrated inorganic salt or organic solvent.

OBJECTIVES: 
1-Study the relation between the structure and the function of proteins.
2- Understand how temperature, pH and salinity affect to the protein structure.


CATALASE ACTIVITY: 
Catalase is a common enzyme found in nearly all-living organisms exposed to oxygen. It catalyzes the decomposition of hydrogen perioxide (H2O2) to water and oxygen. It is a very important enzyme in protecting the cell from oxidative damage and preventing the accumulation of hydrogen peroxide.

PROCEDURE:
In this experiment we are going to test the catalse activity in different environment situations.  We are going to measure the rate of enzyme activity under various conditions, such as different pH values and temperatures. We will measure catalse activity by observing the oxygen gas bubbles when H2O2 is destroyed. If lots of bubbles are producted, it means the reaction is happening quickly and the catalase enzyme is very active. 
1- Prepare 30 ml  of H2O2 10% in a beaker (use a pipet) 
2- Prepare 30 ml of HCL 10% in a beaker.                          -------> Solutions
3- Prepare 30 ml of NaCL 50% in a beaker. 
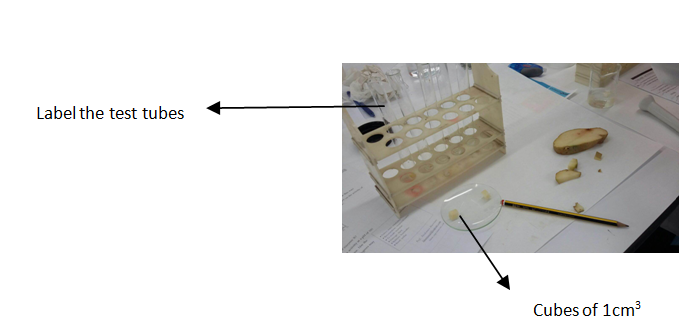
4- Peel a fresh potato tuber and cut the tissue in five cubes of 1cm3. Weigh them and equal the mass. 
5- Label 5 test tubes (1,2,3,4,5)
6- Immerse 10 minutes your piece of potato inside the HCL beaker 
                                                         HCL SOLUTION

 7- Immerse 10 minutes another piece of potato inside NaCL beaker.
8- Boil another piece of potato.
9- With a mortar, mash up the third piece of potato.
10- Prepare 5 test tubes as indicated below:


11- Add  5ml H2O2 in each test tube
12- With a glass-marking pen mark the heigh of the bubbles. Measure it with a ruler.
13- Compare the results of the 5 test tubes.

Table with the important parts of the experiment:
RESULTS: 


 QUESTIONS:
1. How did the temperature of the potato affect the activity of catalase?  
Temperature denaturate the catalase. 
2. How did the change of the pH of the potato affect the activity of catalase?
The change of the Ph denaturate the catalase. 
3. In wich potato treatment was catalase the most active? Why do you think this was?
Mashed potato,  because we had broken the cells and the catalase was more quickly. 
4. An experiment was performed to test the effect of temperature and pH on the activity of Enzyme X. The following data was collected during the experiment: 


a) What is the optimum pH of enzyme X? 8 (maximum activity)
b) What is the optimum temperature of enzyme X? 20 (maximum activity)
c) Why do you think enzyme X has low activity at a pH of 10? Because has been denatured 
 d) Enzyme X perfoms critical life functions. Use the data above to explain why a fever of  40 degrees may be dangerous. 
 Beacuse is more lower than the maximum activity.


Tuesday, December 15, 2015

PROTEIN IDENTIFICATION

BIURET'S TEST:
Biuret's test is a chemical test used concentration.
For detecting the presence of peptide bonds. Polypeptides as proteins, are chains of amino acids link together by peptide bonds.
A peptide bond can be broken by hydrolysis (the adding water). In organisms, protein molecules called enzymes facilitate the process.

OBJECTIVES:
1. Identify peptide bonds.
2. Compare protein concentration in different foods.

PROCEDURE: 
DILUTE THE PROTEIN 
1. Add 100ml of distilled water to each 250ml beaker. Lebel them with M(milk), EW (egg white), EY (yolk), P (potato) and RM (rice milk)
2. Separate the egg white and the yolk in another beaker.
3. Smash the potato in a mortar and add some amount of the smashed potato to the P beaker.

PREPARE THE SAMPLES:
4. Add 10ml of a dispersion of each food (M, RM, EY, EW and P) to the indicate beaker. Calculate the final concentration. All the groups will use the same dispersion from the beakers.
5. Prepare 6 test tubes (cleand and dry) and lebel (M, RM, EY, EW and P). Add 2ml of the every food dilution of each beaker.


6. Add 2ml of 20% NaOH dissolution. 
7. Shake gently and add 5 drops of CuCO4 in each tube. Allow the mixture 5 minutes. 
8. Note any colout change. Remember that proteins will turn solution pink or purple. 
9. Compare the test tubes. 


---------> CuCO4


----------> NaOH

Observations and results: 

RESULTS: 
Positive: M, EW( more proteins that the EY) and EY (have a lot of lipids)
Negative: P, RM 

- The concentration of proteins change the colour. 
- The sodium hydroxide change the pH (basic) 
- The copper change the colour. 
- The food that has more proteins is the milk.